Questions?
Comments? E-mail Robert T. Chisholm, Associate Member OSPE, at attention_to_the_facts@hotmail.com
A1.6.
IMPORTANT ADDITIONAL QUESTIONS LEFT UN-ANSWERED. SOME GENERAL EFFECTS OF MIS-GUIDED
IMMIGRATION POLICIES.
The “who you know” factor, and its influence in hiring
practices, is being over-emphasised in such a way as to create warped
perspectives in the workplace, at the expense of people having persistent
trouble getting any work.
Probability Groups in a Job Applicant Population.
Paul Swinwood quoted a figure of between 300 and 800 in
April 2003, when he was President of the then-Software Human Resources Council.
Higher figures have been quoted elsewhere.
In the following example, we assume 800 applicants for the
same job, hence an average success probability of 1/800 every time you apply
for one. It does not follow that the
probability of success is the same for all the 800 applicants, for obvious
reasons. It is instructive to try to break down the 800 applicants into
most-favoured sub-groups and least favoured sub-groups, for instance as
follows:-
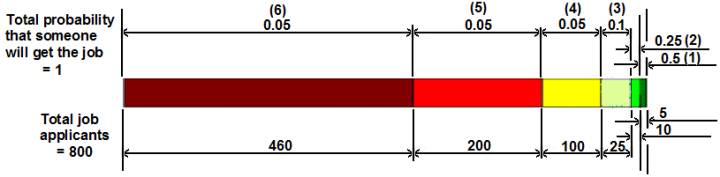
In the chart above, the
different sub-groups are as follows:-
(1) Most-favoured applicants – usually
already working in the field. The top 5 people, with a 50% chance of one of
them getting the job. Persistently favoured and lucky.
(2) Next 10 people - next most-favoured
applicants - usually working, possibly in a different field, with a 25% chance
of one of them getting the job.
(3) Next 25 – good applicants – usually
working, possibly less experienced than groups (1) and (2), with a 10% chance
of one of them getting the job.
(4) Next 100 – most favoured applicants
– unemployed, but not for long.
(5) Next 200 – good applicants –
unemployed.
(6) Next (lowest) 460 – “Not in the
Labour Force” – long term unemployed, persistently dis-favoured.
Obviously the group of 800 job applicants can be broken down
in many different ways, with different probabilities of success assigned to
each. But no matter the method used for sub-grouping the 800 job applicants,
the sum of the probabilities for the individual sub-groups must always equal
1.
For sub –group 1: 5
applicants for 0.5 jobs equals 10 applicants for 1 job, hence a 1 in 10 chance
that any one job application will succeed.
At the other extreme, for sub-group 6: 460 applicants for 0.05 jobs equals 9,200 applicants for 1 job, hence a 1 in 9,200 chance that any one job application will succeed.
The other dimension to this is the numbers of people
applying for every job publicly advertised (as opposed to “word of mouth” or on
corporate intranets AND VISIBLE ONLY TO EMPLOYEES). Figures are seldom
quoted but typically range between 36 and 5,000. This also serves to expose
contradictions appearing in the mass media suggesting “skills shortages”, or
some such.
CONTRADICTIONS LIKE THIS AND THE RESULTING CONFUSION AND
OBFUSCATION ARE NOT ACCEPTABLE – OTHER THAN FOR THOSE LEADERS IN THE BUSINESS COMMUNITY AND IN GOVERNMENT WHO WANT TO KEEP THE MESS GOING.
SOME GENERAL EFFECTS OF MIS-GUIDED IMMIGRATION POLICIES
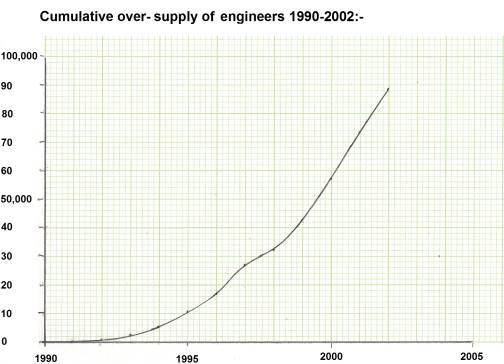
Paul Martin, P. Eng (Ontario), has provided the following
information – among other things - about a gross oversupply of engineers to
Canada between 1990 and 2002 caused by flawed immigration policies. This,
again, applies as much to the NCR as to Ontario and Canada in general, in the
absence of any proof to the contrary.
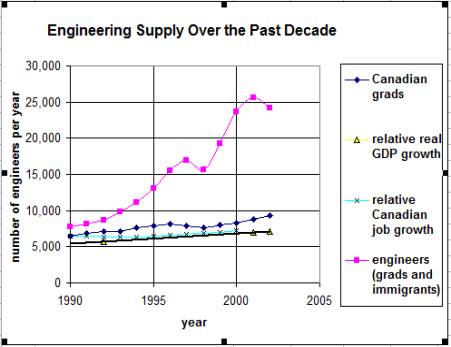
As this shows, there were not enough jobs being created even
to absorb just Canadian engineering graduates from 1990 to 2002 inclusive. So how
was it even possible that there would be any jobs open to foreign-trained
professional engineers? Compare the pink curve with the pale blue one.
In what follows, “OSPE” = “Ontario Society of Professional
Engineers”.
In April 2013, OSPE’s Mr. Ray Givens, P. Eng., met The Honourable Jason Kenney,
then-federal Minister of Citizenship and Immigration. This was an informal
meeting, about a massive over-supply of foreign-trained professional engineers
in Ontario which had been worsening
since at least as far back as 1990.
This, it was quite clear, had been caused by flawed immigration
policies. Prior to then, Mr. Kenney was
getting the opposite story from many different sources – namely, to the effect
that there was an engineering skills shortage.
Among other things, Mr. Kenney asked Mr. Givens why nobody had informed
him earlier about what was going on. He also showed considerable interest in a
graph depicting the situation from 1996 to 2011, that Mr. Givens gave to him.
MORE INFO ABOUT MASSIVE
OVER-SUPPLY OF ENGINEERS IN ONTARIO AND CANADA AS A WHOLE: CLICK HERE
THE PROBLEM OF LACK OF ON-THE-JOB TRAINING.
The Ontario Society of Professional Engineers (O.S.P.E.)
also raises the following question: “Where has all the training gone?” in “The
Voice”, Fall 2013, article “Now Hiring Engineers?” Quote from this same
article;-

That’s the sort of thing that is liable to happen if we deny
all knowledge of any need for on-the-job training at all, based on a massive
over-supply of people relative to what the job market can absorb. What O.S.P.E.
says applies as much to the NCR as to Ontario in general, and contains
important lessons for Canada as a whole.
And why is nothing being done about the lack of access to government–funded retraining caused by dysfunctional rules and regulations connected with federal E.I. and provincial social assistance programs? Two useful programs that could and should be made generally available are Ontario Job Creation Partnerships and Ontario Targeted Wage Subsidy. (Prior to January 1st 2007, these were known respectively as “ON-SITE” and Targeted Wage Subsidy, run entirely by the federal government’s H.R.S.D.C.).
MY OWN CASE INVOLVING REFUSAL OF ACCESS TO RETRAINING - ON THE JOB, OR ANYTHING ELSE.
Retraining must be made available for all people out of work in Canada, without any E.I. – related restrictions or provincial social assistance-related restrictions.
That was NOT my experience, after losing my job
with SNC just 15 weeks
after arriving in Montreal, Quebec in April 1982 and starting work with them.
The mess was caused by people in government,
who should have known better and used some common sense. But instead they just
exploited the “letter of the law” in order to
continually assert that I was “not eligible”
for any government-funded retraining and in most cases this was due to alleged
“lack of insurable weeks” of employment. That situation
involving “lack of insurable weeks”, in turn,
was precipitated by SNC dismissing me after just 15 weeks and that was less
that the 20-week minimum required of “new entrants to the
Canadian labour force”.
Nobody ever even told me anything about that “20
week rule” before I left the U.K., either.
EVER-EXPANDING ABSURDITIES IN THE JOB HUNTING PROCESS
This sort of thing, aggravated by the lack of jobs relative to numbers applying for them, has led to ever – expanding absurdities in the job hunting process. The example below is from 2005 – long before the additional nonsense specifically in the NCR resulting from the financial “crash” from about September 2008 onwards, the Nortel bankruptcy in Ottawa, and so on.
Reference: “Some job candidates getting too slick for interviewers” By VIRGINIA GALT, Globe and Mail, Monday, Feb 7, 2005
(The full text of this can still be seen at http://groups.yahoo.com/group/OttawaHiTech/message/4594
- and it can always be retrieved from public library information systems, in
case somebody decides to dispute that this ever appeared.)
This article refers to Canada as a whole - but applies as much to just the NCR, in
the absence of any proof to the contrary.
EXAMPLES OF
OTHER INDICATORS OF TROUBLE ASSOCIATED WITH FLAWED IMMIGRATION POLICIES:-
Skilled IT Worker Shortage a Major Concern April 04, 2008 article by Tess van Straaten
in the periodical, “Business Edge”. No admission of numbers of
people in Canada out of work or any need for any retraining in this article -
or any of the information sources for it. Major omissions:-
Many other manifestations of trouble going back
decades. Examples:-
(1) Article
in “The Star” newspaper Jan 13th 2006 by Haroon Siddiqui,
“Immigrants subsidize us by $55 billion per year”. CLICK HERE
Quote: “ In the fight for equality, one of our
major continuing challenges is the major employment barriers which still exist
for our newer immigrants. These immigrants are, more often than ever, highly qualified professionals and business
executives who find it very difficult to obtain equivalent employment in
Canada. Encouraged to immigrate to Canada, they come with high expectations
which are only too frequently dashed.”
- Ontario Chief Justice Roy
McMurtry
(2) November
2005 video about old www.notcanada.com website:-
Reference:
https://www.youtube.com/watch?v=aCqMWgzaJUI
Key points for immigrants: no jobs, lives and finances ruined, rampant discrimination
Ottawa Business Journal
article
Someone at the federal election all-candidates’ debate at the Ottawa Talent Initiative offices in January 2006 also referred to how job losses in Ottawa's tech sector were being incorrectly portrayed in media reports.
In January 2006, at a federal election
all-candidates’ debate, someone publicly displayed the diagram at left when
describing how job losses and gains in Ottawa's tech sector had been
incorrectly tracked, and how the incorrect approach being used was causing
continual and universal mis-understanding and downplaying of the problem.

It is taken from the following:-
Reference: “Special Report: Is there, or is there not a skills shortage?”
Ottawa Business Journal, Summer Supplement 2006
There was no reference to this “Ottawa Business Journal” Special Report in the Canadian mainstream media.
There have been additional articles in the “Ottawa Business
Journal” concerning bad information and bad analysis of Ottawa’s high tech
unemployment problems - which were also
not referred to in the mainstream media.
In fact this type of problem was not and is not unique to Ottawa,
and was not and is not unique to the ICT high technology sector
Some questions about this 2006 Ottawa Business Journal
Summer Supplement and related matters are raised in Sub-Appendix A1.2:-
A1.2. MORE
ABOUT OTTAWA’S HIGH TECH UNEMPLOYMENT PROBLEM / A1.2
(A) GENERAL
Questions? Comments? E-mail Robert T. Chisholm,
Associate Member OSPE, at attention_to_the_facts@hotmail.com
END
OF PAGE