A1.7.
WHAT IS THE SIZE OF IMPROVEMENT IN THE PERFORMANCE OF THE CANADIAN ECONOMY TO
AIM FOR, AND WHAT FORM MUST THIS TAKE? HOW MANY NEW FULL TIME JOBS ARE
INVOLVED?
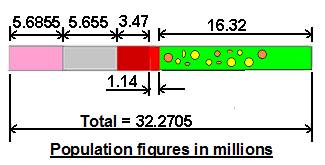
Right now we can only make rough estimates due to the limitations of current
knowledge concerning the size of the overall problem – as indicated in this
graphic above, already presented. The figures shown in the graphic are for 2006
and should be multiplied by about 1.1 to make them relate to 2014, based on the
overall population increase. Other corrections needed involve the fact that the
“official” unemployment rate for January 2006 was 6.5% compared with about 7%
for April 2014, plus the need to account for the percentage changes in the
other figures shown. For instance based on “Ottawa’s Hidden Workforce” of Fall
1998 the number of people actually unemployed but classed as “not in the labour
force” represented 38% of all those classed as such; this might have increased
because of the generally worse state of the economy in 2014 compared with
1998. Full employment means that the
green area must not be “polluted” and the red / reddish-brown areas must also
be green - or at least much reduced. If the whole “polluted” area within the green
zone represents 50% underemployment then we need the equivalent of roughly 5
million new full time jobs to eliminate the problem. Unemployment, both
“official” and “hidden”, represents about another 4.6 million new jobs needed
to eliminate that part of the problem.
For obvious reasons, the same questions must be
raised for the NCR in particular.
Questions?
Comments? E-mail Robert T. Chisholm, Associate Member OSPE, at attention_to_the_facts@hotmail.com
END OF PAGE