CLICK ON THE THUMNAILS TO SEE BIGGER / CLEARER IMAGES
Questions? Comments? E-mail Robert T. Chisholm, Associate Member OSPE, at attention_to_the_facts@hotmail.com
A1.1. UNEMPLOYMENT AND UNDER-EMPLOYMENT: NEED FOR BETTER INFORMATION, ANALYSIS AND REPORTING.
Reference:
“Ottawa’s Hidden Workforce”, Fall 1998
Obviously this applies
specifically to the NCR and in particular the Ottawa C.M.A., but contains
important lessons for how unemployment and under-employment should be reported
throughout Ontario and Canada. Main findings: see
graphics below:-
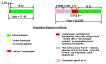
ANOTHER WAY TO SHOW THE
MAIN FINDINGS OF THE 1998 “OTTAWA’S HIDDEN WORKFORCE” REPORT – FOR THE YEAR
1997:-


The average 38,800 “official unemployed” represented
8.8% of the 442,500 people in the “Active Labour Force” in Ottawa, in 1997
And what about NOW – 2014 - when the local economy in Ottawa and the
Canadian economy in general are both arguably in a worse state than in 1997?
The “official unemployed” represent only a small part of the overall problem
and the “underemployment” problem now, across Canada, is several times bigger –
in percentage terms - than the above figure for Ottawa in 1997 would suggest.
Some people might argue that Canada’s economy in 2014 is doing better than
Ottawa’s was in 1998 because the official unemployment rate now is only about
7% - lower than the 8.8% for Ottawa in 1997. But it is common knowledge that
such a conclusion would be incorrect.
CANADA AS A
WHOLE: JANUARY 2006. See charts below.
The left hand diagram in the picture immediately below
applied to Canada as a whole but the situation in the NCR at the time was not
radically different. This is what is routinely given out to the media in the
monthly Labour Force Survey. “Nice green park land” with a little of the usual
kinds of pollution to be expected in such places, but really “nothing to worry
about”.
The right hand diagram is based partly on the
left–hand diagram plus the Fall 1998 “Ottawa’s Hidden Workforce”
report already referred to, plus the March 2006 Statistics Canada
report, “Work Hours Instability in Canada”. More complex, a much bigger
problem that some people refuse to admit even exists, and resembling a
certain well-known type of waste disposal system. More is said
below about this “Work Hours Instability in Canada” report.
This diagram, obviously, is not a strictly accurate portrayal of the
realities for Canada as a whole - or for the NCR, when the figures are
scaled down to reflect just the population of the NCR . But this diagram
will serve to emphasise that, in the NCR and in 2014, the under-employment
problem might be several times bigger than would appear from the Fall 1998
“Ottawa’s Hidden Workforce” report.
Key problem concerning those “Officially” “EMPLOYED”: A SEVERE
PROBLEM OF “POLLUTION” OR “DILUTION” WITH UNDER-EMPLOYMENT, OVERWORK, WILDLY
FLUCTUATING WORK HOURS FROM ONE YEAR TO THE NEXT.
“Ottawa Sun” newspaper report of March 30th
2006:-
“… a five-year survey by Statistics
Canada suggests that only one in three Canadians aged 25 to 54 have jobs
that fall into the category of "standard" full-time work“ –
meaning 34 to 46 hours per week.
Reference:
“Work Hours Instability in Canada”, Statistics Canada, March 2006.
The corresponding actual figure from this report is
35.4% (Table A1 Work intensity
categories and hours variability, by worker characteristics), for all
workers aged between 25 and 54.
Here is a quote from the Abstract of the report:-
“Instability
in work hours is shown to be related to low-job quality, non-standard work,
low-income levels, stress and bad health. This indicates that working variable
work hours is not likely done by choice; rather, it is more likely that these
workers are unable to secure more stable employment.”
End
of quote
The above figures were released in 2006. What about
now – 2014 – following the U.S. sub prime mortgage crisis and its worldwide
fallout? And what about workers aged 55 plus – possibly being forced out by secretly
using “ageism” disguised as something else, as so-called “excuses”?
Reference:
“The Ottawa Citizen”, April 22, 2004:-
This article applied to
Canada as a whole - but its assertions about the people referred to did not and
do not exclude people the NCR, in the absence of any proof to the contrary.
“Older
workers more secure, but harder to re-employ
Long-term unemployment down from early
'90s high, Statistics Canada says”
Quote: “The report says the number
might understate the actual level of long-term unemployment among older workers
because, after a year or more of being out of work, some may give up looking
for jobs and drop out of the labour force.“
End of quote
Note: no surveys etc. are quoted to substantiate this
statement. Nor is there any attempt to
define the meaning in practice of the term “…drop out of the labour force...”.
Yet nobody ever questioned it. WHY?
No wonder the following appeared on March 8th
2014:-
Reference: “Statistics Canada failing to tell whole story
about Canada’s job market, CLC says” – by
Julian Beltrame, Canadian Press, March 6, 2014
This
March 6th 2014 article, again, applies to Canada as a whole - but
its analysis and conclusions also apply to the NCR, in the absence of any proof
to the contrary.
QUESTIONS TO FEDERAL INDUSTRY MINISTER TONY CLEMENT IN 2010, WHICH I SUBMITTED THROUGH DAVID MCGUINTY M.P., NOT ANSWERED CLEARLY
Among other things, this
requested an explanation of the meaning and application of terms such as “…given
up looking for work…” and “…dropped out of the labour force…” when referring to
people out of work. Clear answers were not forthcoming.
Details: HERE
QUESTIONS TO STATISTICS CANADA ON NOVEMBER 20TH
2014, AND THEIR ANSWERS, WHICH AGAIN
WERE NOT CLEAR.
The questions referred to were
raised during a live online chat session, on November 20th
2014, on the following topic:-
"An overview of recent macroeconomic development in Canada"
Details: HERE
CANADA’S JOB MARKET UNDERPERFORMING FOR YEARS
WHY has this mess been allowed to go on since at least as far back as
1982? WHAT IS THE EXCUSE?
Ottawa’s high tech unemployment problem: simplistic
portrayal, and wrong analysis thereof:-
Obviously
what is said about this below applies specifically to the NCR (meaning, the
Ottawa-Gatineau C.M.A.) - but contains obvious and important lessons that are
applicable across Canada, concerning pitfalls that must be avoided when
reporting on localised unemployment and under-employment problems.
And what
about THIS, at RIGHT? The diagram “Ottawa-Gatineau tech employment”, at left,
has been adapted from “Behind the Numbers…” by James Bagnall
and Andrew Mayeda, in “The Ottawa Citizen”, July 13th 2006.
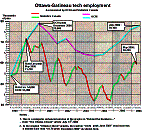

Nobody was thinking about this at the time. WHY? They
were all tacitly assuming that the BEST of these three cases always applied –
meaning, that all those laid off during downturns in the overall number employed
could be assumed without question to have been re-hired during subsequent
up-turns. Nor was anybody questioning
how both of the trends shown in the chart “Ottawa-Gatineau tech employment”,
above, could be correct when this was actually not possible.
Now compare this with the following:-
Reference: “Life After the High-tech Downturn: Permanent Layoffs and
Earnings Losses of Displaced Workers”, Statistics Canada, July 20th 2007
Quote from the Abstract:-
End of
quote
- In other words, the reality of what was
happening was much closer to the type of “WORST” case shown in the Venn
diagrams above, contrary to what O.C.R.I. and media reports at the time were
suggesting.
Quote from page 8 of this report:-
“The data requirements for the study are quite
substantial. First, one needs to be able to identify high-tech workers. Second,
one needs to be able to identify workers who have been permanently laid off.
Third, the sample of laid-off high-tech workers must be large enough for
analysis. Fourth, the data need to be longitudinal in order to follow
laid-off workers. Fifth, the data must have information on earnings of workers,
as well as a sufficient amount of worker and firm characteristics. Given
that the high-tech sector makes up less than 10% of the Canadian economy, and
that information on the reasons for separation is rarely available in large
data sources, it should come as no surprise that virtually all Canadian data
sources containing the appropriate information are much too small for the
required level of detail.”
End of quote
This quote constitutes conclusive evidence of “sets”
and Venn diagrams (such as the ones shown above) being paid attention to, “ …in
order to follow laid-off workers…”, which was always a requirement for a proper
analysis. Nobody was doing it until this report appeared. In other words, the information being fed to
everybody about Ottawa’s problem - through the mass media - was confused,
incomplete and incorrectly interpreted.
Quote from
page 9 of this same report:-
“The sample consists
of workers aged 25 to 49 in the year prior to a potential permanent layoff
(year t − 1). Older workers are excluded, since they may
contemplate retirement following a permanent layoff. Younger workers are excluded,
since they may simply return to school if they lose their jobs. …..”
End of
quote
No attempt is made to substantiate these statements
on page 9 of the report, which indicate social bias at the expense of “older
workers” and “younger workers”. Why
make such un-qualified statements in the first place?
Questions? Comments? E-mail Robert T. Chisholm, Associate Member OSPE, at attention_to_the_facts@hotmail.com